More than half of municipal web applications run on US cloud infrastructure


Of this group of applications, half (50.5 percent) are routed through or hosted in the United States. 46 percent are hosted by U.S. cloud providers in Europe.
Only 39.3 percent of all applications used are hosted and operated entirely in Europe. The remaining approximately 1.5 percent runs outside Europe and the US, for example in Asia.
“We also ran into this ourselves,” says Merijn de Jonge, CEO of MindYourPass. “We deliberately chose a European data center with an American cloud provider, assuming that everything remained within Europe. It wasn't until we analyzed our own infrastructure that we saw that data traffic can still run via the US. That was an important reason for us to start this investigation.”
The research shows that a conscious choice for a European data center with an American cloud provider does not automatically mean that data traffic also remains entirely within Europe. Even when data is physically stored in Europe, traffic along the way can pass through the United States, for example because of the way networks and load balancers are set up. In that case, data is not only legally affected by US legislation such as the Cloud Act, but also technically passes through the US.

Top 20 most used applications: limited differences
In addition to the overall picture, MindYourPass also looked at the twenty most used business web applications within municipalities. Within this group, 54 percent runs on infrastructure provided by US cloud providers. In 33.3 percent of these applications, data traffic may run via the United States, for example because data centers are located there or because traffic can be routed through the US. 46 percent is hosted and operated entirely in Europe.
.png)
Most critical applications: hardly any other dependencies
Next, we looked at applications that were classified by municipalities themselves as critical or high-impact. Within this group, 40 percent of the applications run on US cloud providers. 50 percent of data traffic may run through the United States or be hosted in the United States. A total of 60 percent of these web applications in Europe are hosted by a European host.

* One hosting location is displayed per application. It is based on the specific service or URL that, within this analysis, is most relevant based on actual use and risk profile. Many suppliers offer multiple services with different technical and geographical features. KPN is one example: the entry in this overview is based on a specific login or authentication service with a technical relationship to the United States. This explicitly says nothing about the hosting location or dependencies on other KPN services.
“With the most critical applications, we do see a different picture than average,” says Merijn de Jonge, CEO of MindYourPass. “The share hosted in the United States is lower, at 40 percent. At the same time, this means that foreign dependencies also play a role in systems that directly affect primary processes and sensitive data.”
Use of AI tools within municipalities
A lot of attention is paid to so-called shadow AI: AI tools that are used outside formal IT and purchasing policies. The analysis of actual usage shows why. The twenty most used AI tools in municipalities are all hosted in the United States. This is not just about experimental applications, but about tools that are structurally used for writing, analyzing, summarizing and editing content.
.png)
Many municipalities have formally established policies for using Microsoft Copilot. However, in practice, we see that the most used AI tool is OpenAI's ChatGPT.
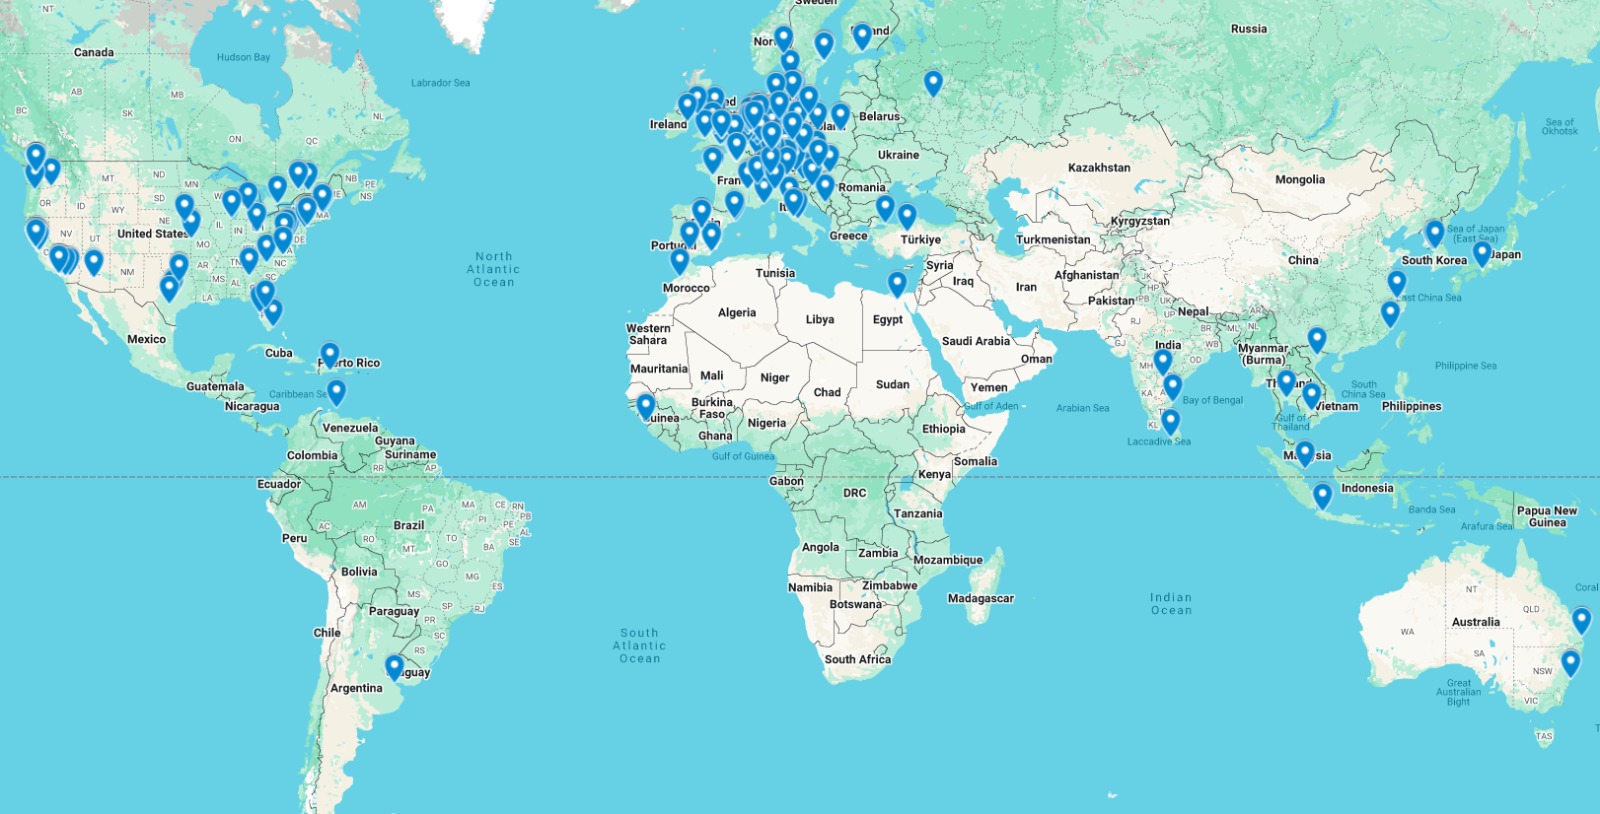
Get your own insight into applications and hosting
For municipalities, policy makers and journalists who want to investigate for themselves where specific applications run and with which cloud providers, MindYourPass has developed an interactive map.
This map shows cloud hosting locations and providers, including the municipal web applications that are actually used there. The map therefore does not show all applications that run with a cloud provider, but only the applications that were observed in this study based on login traffic from municipalities.
Because this is sensitive information, the map is not freely accessible. Access can be requested using the form at the bottom of this article. Once access is granted, applications can be viewed by usage, hosting location, and ownership structure.
About the methodology
This study was conducted on the basis of anonymized login and usage data from 20 Dutch municipalities. To be precise, a total of 1,964,128 login moments for 12,527 different applications were analyzed in 2025.
The associated IP addresses of 12,170 applications could be determined, making it possible to analyze the hosting location and ownership of the underlying infrastructure. 7,664 of these applications are classified as business applications. To determine the geographical locations and ASN numbers, the advanced services of ipinfo.io. ChatGPT was used to find company names based on ASN numbers.
Applications are then classified according to the intensity of use. Municipalities themselves have indicated which applications are critical.

Get in touch with us.
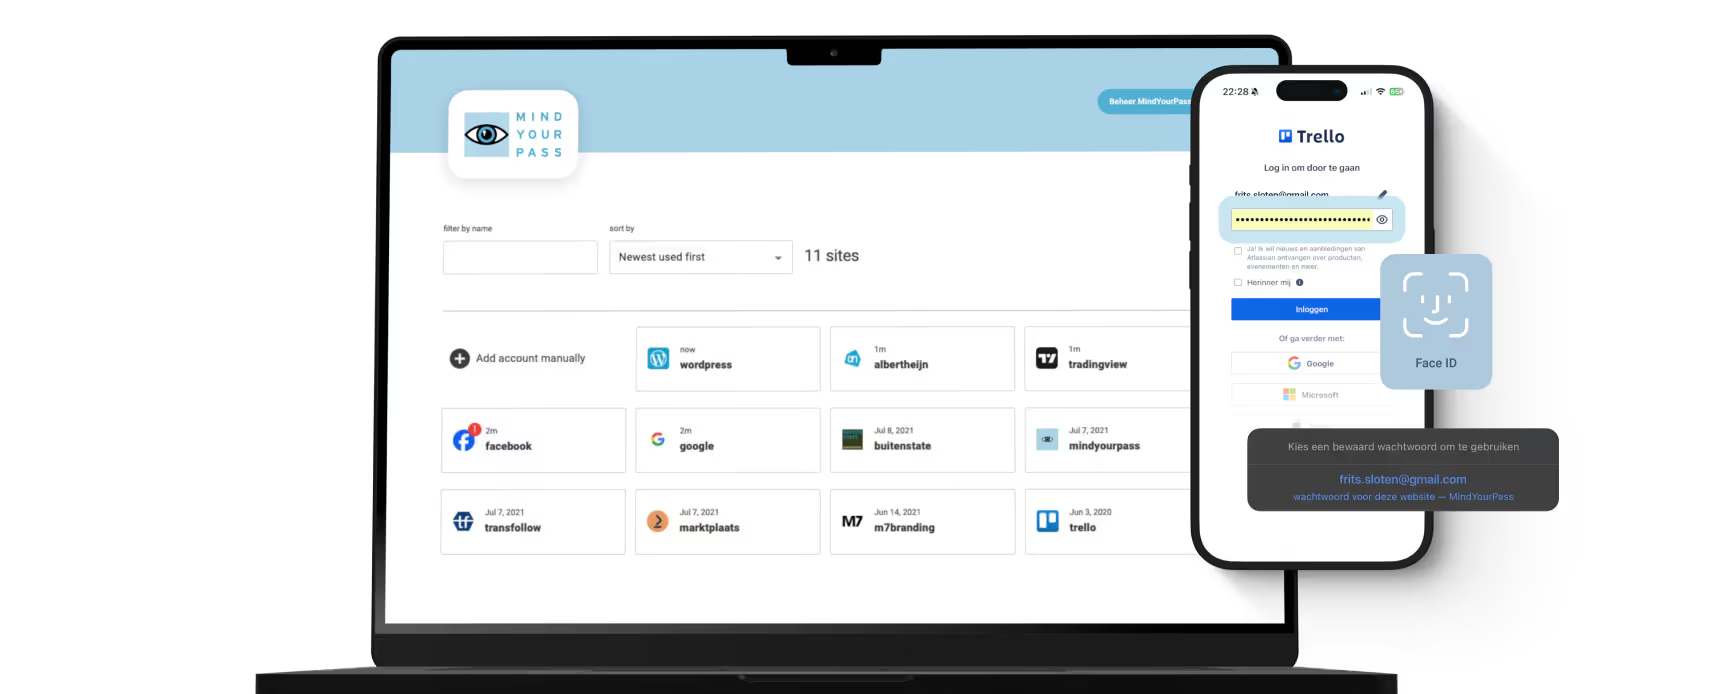
Let MindYourPass make your organization safe.
Log in securely with ease.
At home and at work.


Triple-i™ improvement method
Wachtwoordveiligheid meten om doelgericht te verbeteren
Elke verandering begint met het verkrijgen van volledig inzicht in de huidige situatie. Om vanuit daar met behulp van een concreet en praktisch plan toe te werken naar de gewenste situatie: het gebruik van kwetsbare wachtwoorden binnen jouw organisatie onmogelijk maken.